Our Approach
Data Made Easy
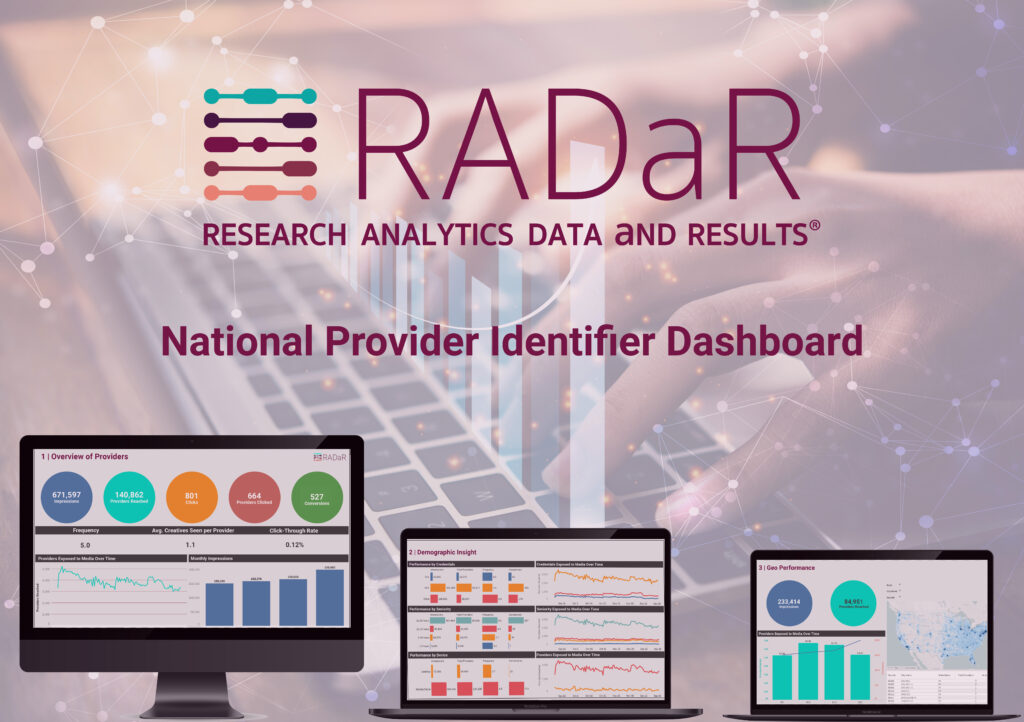
Our customized solutions range from unique dashboards to personalized support. While the details of our services vary, our offerings all provide the same end result: We make data easy to understand and, most importantly, easy to use.
A Dedicated Team
When you work with RADaR, you work with your very own team of data specialists and business consultants. You won’t deal with anonymous helplines or chatbots. You’ll have direct access to experts who know the ins and outs of your data — and your business.
Humanizing Data
We don’t deliver numbers and reports without explanation. We give our clients the tools they need to both understand their data and put it into action. Plus, our team is available to provide support and guidance whenever it's needed.
Real Change
We use statistics to guide a variety of real-life decisions, from when to spend on media to which players should be in the starting lineup. With our support, our clients can improve their bottom lines, achieve their business goals, and drive real change within their organizations.