There are a multitude of approaches to data visualization, but one of the most important ones is the marketing data dashboard. A dashboard is a powerful tool that gives users an up-to-date overview of all the key metrics and measures that demonstrate success in campaigns and companies in a humanized and visual way. This snapshot can be accessed anytime and is essential for any successful organization to stay on top of its performance.
Keep It Simple
All dashboards must be simple and clear with an interface designed for quick viewing, immediate takeaways, and backend bandwidth to collate all appropriate data. For our clients, that can mean a clear “traffic light” indicator of status across many variables from impressions, total clicks, click-through rates, CPM, CPC, and Cost Per Completed View. and measured across media channels including display, Facebook, YouTube, and digital native environments.
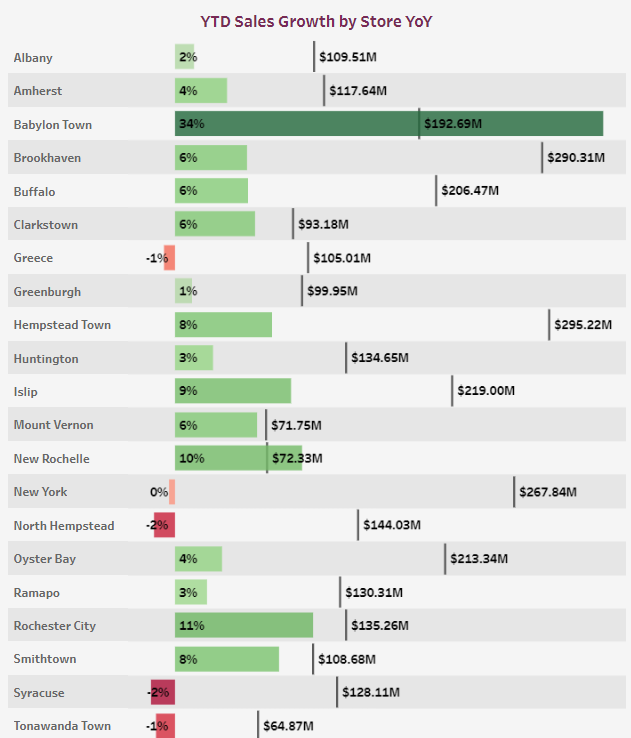
Using color to demonstrate performance is an easy part of the visual language we love to implement regularly. Every media tactic is monitored and measured, with performance outputs coming in the form of green “lights” – tactics that are delivering against program goals. Orange under-perform in the region of 50-75% success rate, and red, where tactics for whatever reason are off pace and off plan by more than 50%. In short, dashboards must use a shorthand that translates complex data points into a simple, universally understood visual language for even the non-savvy viewer.
There are two essential types of views regarding effective visualization: the story view and the reporting view. The story view is declarative and provides an instant answer to crucial questions important to brand managers. The reporting view is exploratory and structured with more self-selected dropdown filters that allow a user to dig into their data with increasingly granular levels of detail.
Catch Up: Read Part One of the Humanizing Data Series Discussing Commitment
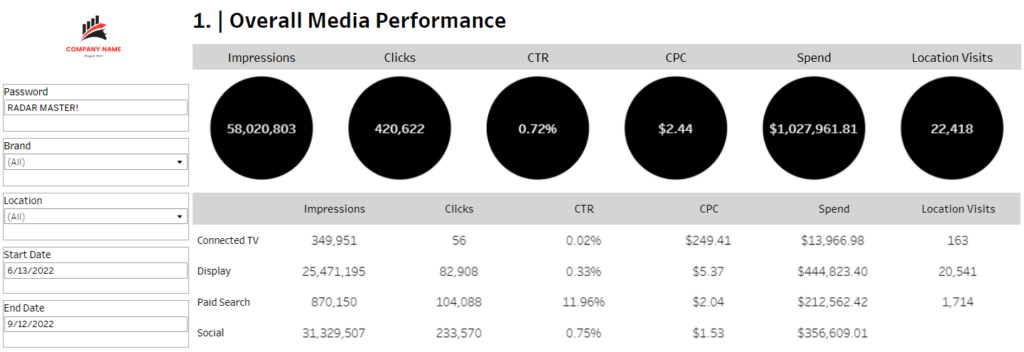
Data Visualization: The Story View
One of the biggest inquiries from companies looking for data help is “Is my spend working and how?” Story view visualizations must contain a clear throughline for quick-read analysis at the highest level. A user needs to be able to rely on sharp visual communication when looking for a quick couple of nuggets to relay back to their team. Having a data dashboard with a clean, visual aesthetic and zero space wasted on filler metrics is the quickest way to assure that anyone can glean the insights you're intending to show.
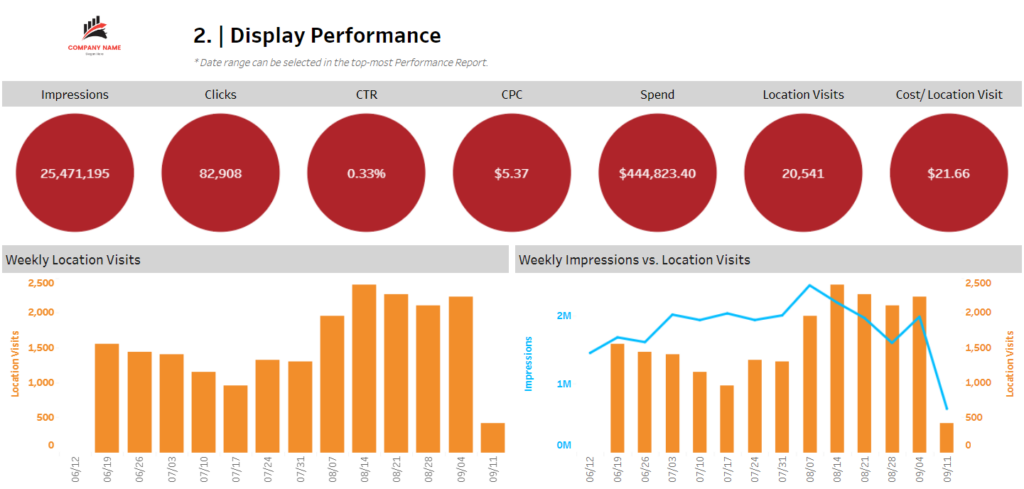
Data Visualization: The Reporting View
At other times, you'll have experienced teams ready and raring to dig directly into their data. This is where a strongly visualized reporting view can be a huge asset when delivering a dashboard. At RADaR, we spend a lot of time when initially bringing in a client's data to confirm that it will be easy to group and filter for specific reports. This process cuts down on confusion as campaign data starts to flow in, as well as allows users to confidently filter down to exact portions of their dataset (depending on the request at hand). While detailed visualizations may not usually accompany these straightforward views, it remains vital that they are free of any clutter and most importantly, easy to read.
Humanizing Data: What's Next?
Our next stop on the road to humanizing data will be embracing data as a decision-making tool to answer your company's key questions. If you have any questions pertaining to any of these steps or something completely different and just flat-out need some help, contact us here!