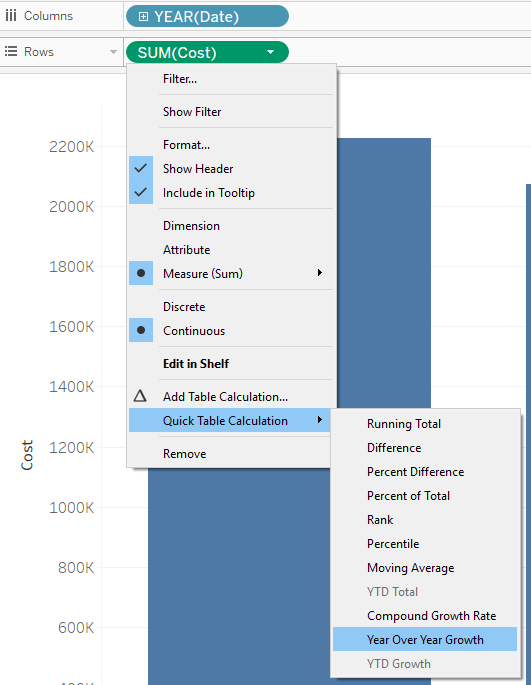
- Drag YEAR(Report Date) to Columns
- Drag SUM(Cost) to Rows
- Click on SUM(Cost) > hover over Quick Table Calculation > select Year Over Year Growth
Trick
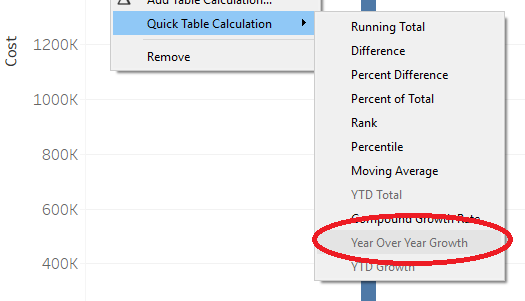
Make sure YEAR(Report Date) and MONTH(Report Date) are in discrete format (in blue color) instead of in continuous format (in green color). Otherwise, the Year Over Year Growth option will be greyed out. See below:
Tip
You can use the same approach to compare
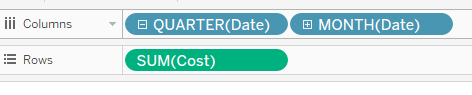
- Quarter to date year over year
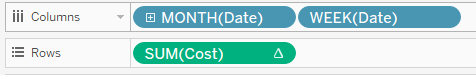
- Week to date year over year
- or any other comparison as long as you have YEAR(Date) and another date level in the Columns.