While the world stopped to watch the big football game in mid-February, our team decided to pay more attention to the advertisements running throughout. 102 of them, to be exact, from kickoff to the final whistle, which we then logged into a dataset in hopes to further monitor. We went a step further and broke down each ad to see what trends we saw in terms of industry vertical, humor level, and use of celebrity spokesperson.
Here is what we found:
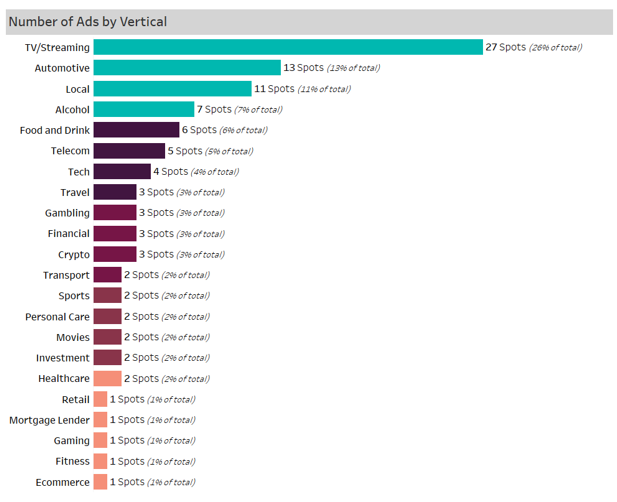
The largest amount (26%) of the spots were promoting TV and streaming programs, which should not come as a surprise as NBC carried the game and were more than eager to shine a light on programming for NBC, Peacock, and Hulu. According to a recent Deloitte study, U.S. subscribers have accounts with an average of four streaming video services. Staying true to the current market of entertainment, that number far outweighed the spots dedicated to movies coming soon to a theater near you (2 spots; 2% of total). Other industries vying for the most spots bought included automotive/electric offerings (13% of total spots) and alcohol brands (7% of total spots). Another cluster of hot-button industries each represented 3% of total spots (travel, gambling, financial, and specifically crypto).

When looking further into the tone of each ad, we broke each down into either being humorous or not and found that humor just slightly won out as the overall tone for 2022.

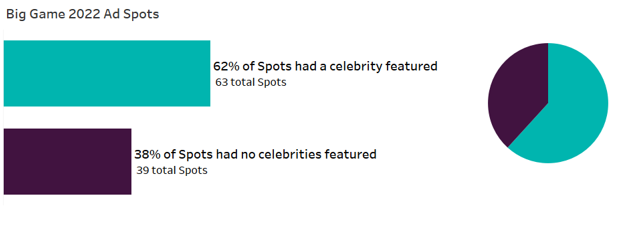
The last bit we wanted to track was whether or not a celebrity was utilized in delivering each brand’s message or not. The answer was 62% of all spots even while keeping the local spots in the dataset, which failed to feature any celebrities through 11 advertisements in our market.

Going forward, we plan to continue building this dataset for years to come with hopes to get a much better understanding of these current trends and new ones year-over-year. We are also eager to delve into other major sporting events to identify any similarities or differences between those media decisions. Our team will definitely be busy this spring, starting with analysis of the upcoming college basketball tournament. Stay tuned!
Data Visualizations created by Adam Vonder Haar
